Excel is a powerful tool for data analysis and visualization, and it’s often used to present data in the form of charts and tables. However, when it comes to printing these charts and tables together, many users struggle with formatting issues that can cause frustration and confusion. In this article, we’ll explore some tips and tricks for getting charts and tables to print together in Excel.
1. How To Get Charts And Tables To Print Together In Excel Steps.
1.1 Step 1: Prepare Your Data.
- Before you start creating your charts and tables, it’s important to make sure that your data is properly organized.
- This means ensuring that all data is in one worksheet or workbook, and that the data is structured in a way that will work best for your charts and tables.
1.2 Step 2: Create Your Charts and Tables.
- Once your data is properly organized, it’s time to start creating your charts and tables.
- Excel offers a wide range of chart types, including column, bar, line, pie, scatter, and more.
- To create a chart, simply select the data you want to use, click on the “Insert” tab, and choose the type of chart you want to create.
- Tables are created by selecting the relevant data and clicking on the “Table” function under the Insert tab Tables group.
- You may also format a pre-existing set of data into a table if desired.
1.3 Step 3: Format Your Charts and Tables.
- After you’ve created your charts and tables, it’s important to format them so they look their best.
- This involves adjusting things like fonts, colors, and labels to make sure they are clear and easy to read.
- You can do this by clicking on the chart or table and using the formatting options that appear in the Excel ribbon.
1.4 Step 4: Move Your Charts and Tables.
- Once your charts and tables are formatted to your liking, it’s time to move them into position on your worksheet.
- You can do this by clicking on the chart or table and dragging it to the desired location on the worksheet.
- Excel will automatically adjust the size of the chart or table to fit the available space.
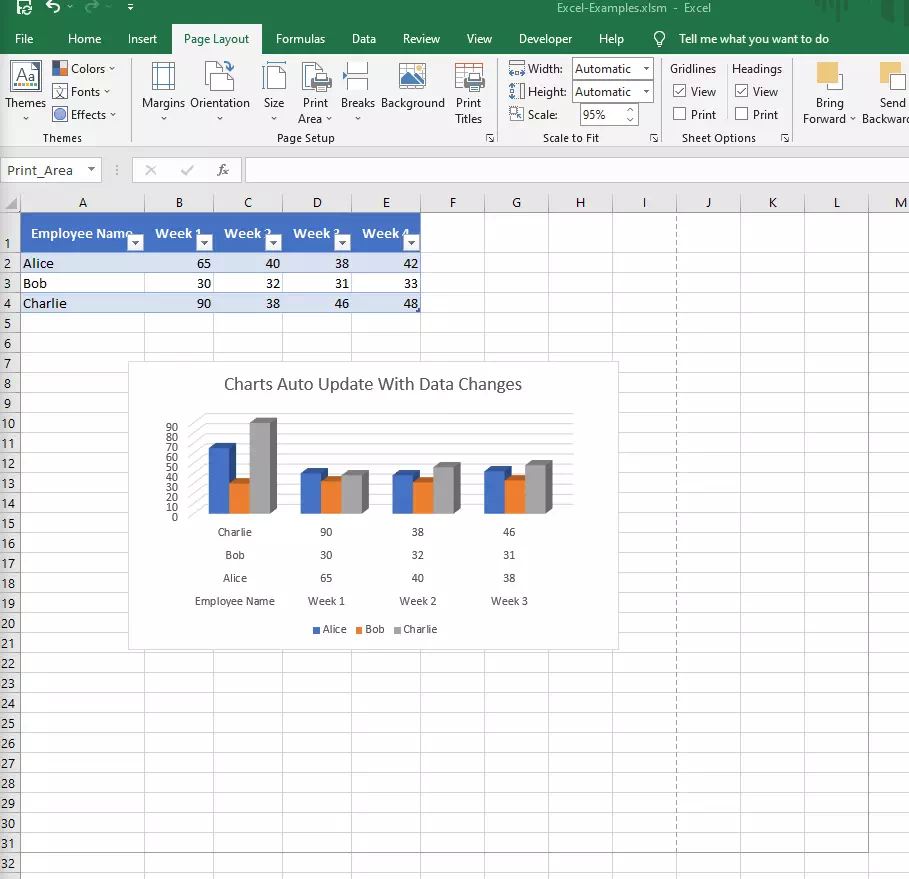
1.5 Step 5: Set Your Print Area.
- Now that your charts and tables are in position, it’s time to set your print area.
- This tells Excel which part of the worksheet you want to print, and ensures that all of your charts and tables will be included in the printout.
- To do this, simply select the cells containing your charts and tables, click on the “Page Layout” tab, and choose “Print Area” from the “Page Setup” group.
- Next, click on “Set Print Area” to define the print area.
1.6 Step 6: Print Your Charts and Tables.
- With your print area defined, you’re ready to print your charts and tables.
- Simply click on the “File” tab, choose “Print“, and review the print preview to make sure everything looks as expected.
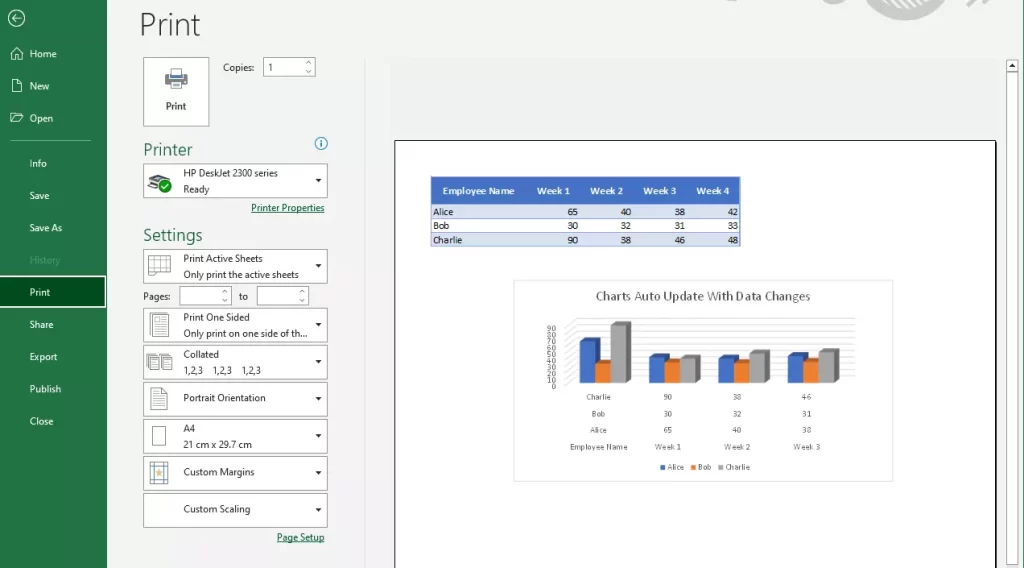
- If needed, you can adjust the page orientation or scaling options to ensure everything fits on the page.
2. Conclusion:
- In conclusion, getting charts and tables to print together in Excel is a simple process that requires proper data organization, chart and table creation, formatting, positioning, and printing.
- By following these steps and examples provided above, you can easily create professional-looking charts and tables that are ready for printing and sharing.